We conclude our analysis on the year of the pandemic by including the last 4 months, which coincided with the beginning, for Italy, of the so-called “second wave” of Sars-CoV2.
To contextualize the data, it is necessary to relate them to the containment measures adopted during the year we had already talked about in the previous article, to which the following must be added:
October 8: obligation to wear masks even outdoors and possibility for the regions to tighten the restrictions
October 13: limit on the number of people hosted in private homes; limit on spectators to indoor and outdoor events and on attendance to parties or ceremonies; restrictions on opening hours for restaurants and bars
October 18: ban on activities such as conferences, congresses, festivals and community fairs unless of national interest, possibility for schools to activate distance learning
October 22-24: introduction of curfews in various regions, further restrictions on opening hours for restaurants, closure of gyms, swimming pools, cinemas, theaters, game rooms; ban on parties and ceremonies, activation of distance learning for high schools
November 6: introduction of restriction tiers at regional level (or autonomous provinces) called “red”, “orange” and “yellow” in decreasing order of strictness
December 21: for the Christmas holidays, homogeneous restrictions have been adopted throughout the national territory, more stringent on festive days.
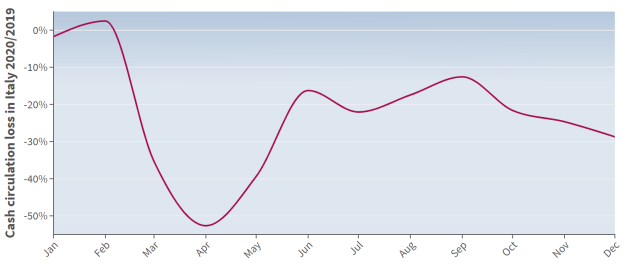
The data show the recovery of cash level on September (the last month without any particular restrictions), before a further fall with the tightening of measures.
Analyzing the data from a geographical point of view, a substantial uniformity of data is confirmed (apart from the case of the small alpine region of Valle d’Aosta, where cash has fallen more than elsewhere). To confirn the lack of correlation between cash usage and outbreak of the virus we can compare the data from Lombardy to those from Veneto. Lombardy had a peak of incidence almost coinciding with the month of November, and remained in the “red tier” until the 28th of the same month. The Veneto region also underwent a rapid increase in incidence in November, reaching about 3/4 of the level of Lombardy, but here the incidence remained high until the end of the year: around mid-December it was 3 times higher that of Lombardy, where in the meantime the emergency was over. From a regulatory point of view, however, Veneto remained in the “yellow tier” until the Christmas holidays. The infographics clearly show how, despite the incidence of the disease in Veneto by far exceeding Lombardy in December, in the latter region cash continues to drop more than in Veneto, albeit slightly. It is, therefore, evident that the restrictions affected the cash usage trend more than the outbreak incidence itself.
The chart shows the incidences of the outbreak in Lombardy and Veneto; the background indicates the tiers for Lombardy in the lower part and for Veneto in the upper part [1] [2] [3].
Another interesting fact is the introducion of the “state cashback” on electronic transactions, valid from December 8, to discourage the use of cash. Measuring the effect of this provision is not easy since it overlapped with the aforementioned restrictions for the days of Christmas shopping. We try to estimate it by comparing the last quarter data on household consumption expenditure provided by Italian retail conferedation (Confcommercio). It is not possible to compare the decline in absolute terms as this index includes goods and services that are typically not paid in cash (real estate, automotive, utilities, etc.). However, we can compare the data of November and December: while cash in general accelerated the decline (-24.66% in November compared to -28.73% in December), consumption recorded a recovery from -16.2% in November to -11.1% in December [4], so it is plausible to attribute to cashback a further reduction in cash. By restricting the analysis to large-scale retailing (supermarkets and shops in shopping centers, activities which are more involved by the cashback), this gap is even more evident.
Summarizing all the analyzes carried out in 2020 we can conclude that:
External sources:
Gazzetta Ufficiale https://www.gazzettaufficiale.it/
ISS – Open Data Covid19: https://github.com/pcm-dpc/COVID-19.
dati demografici ISTAT http://demo.istat.it/bilmens/index.php
Congiuntura Confcommercio https://www.confcommercio.it/documents/20126/3212567/Congiuntura+Confcommercio+%28CC%29+1-2021.pdf/07e88554-dd1b-9183-1bf0-b08132b833f0
I cookie ci aiutano a migliorare l’esperienza del nostro sito web. Continuando la navigazione, accetti l’utilizzo dei cookie da parte nostra.